Juror Attitudes in the Age of the Coronavirus:
How are Americans Coping with the Pandemic?
The COVID-19 pandemic has impacted our lives in ways we might not fully understand for many years—if ever. Students of American history will look back on these times to inspire hundreds of different theories on how it all went up and/or downhill for the American experiment from here. Until those future tomes and the passage of time reveal their wisdom, a first draft of that history is already being written. In March 2020, DecisionQuest began a series of research studies on how the pandemic is affecting Americans emotionally, intellectually and behaviorally. The present effort echoes other nationwide surveys DecisionQuest has undertaken over the years like after the financial scandals of the early 2000s, after 9/11 and after the Great Recession of 2008-2009. Although our psychological research generally concentrates on jury decision making, our 25-year archive of data from surveys, mock trials, focus groups and juror interviews can also be mined for insights into the larger sphere of our shared life as a society.
On a technical note, the study reported here consisted of nearly 3,000 online interviews of jury-eligible adults in 11 states and 12 major metropolitan areas[1]. While these particular samples might not reflect attitudes in all of the 3,100 or so counties of the United States, it is certainly representative of these high-litigation venues. Our research is ongoing, but at present consists of three waves, conducted in March, May and October of 2020. About 100 questions were posed to the samples in each wave, with most questions being repeated to allow a better assessment of historical trends. With each new iteration, the questionnaire was expanded to encompass unfolding events. For example, the last day of the wave 2 survey was the day George Floyd died in Minneapolis; thus, wave 3, conducted in October, incorporated questions on racial injustice, social justice protests, law and order and related issues. The next wave will examine how these sentiments might have changed before and after the recent presidential election.
And on a theoretical note, psychologists are wont to parse a question like this into its “ABCs,” i.e., its affective (or emotional) components, its behavioral manifestations and associated cognitions (or intellectual processes). Psychological research has long since dismissed the simplistic notion that overt behavior necessarily falls out from emotions or cognitions, viz. cognitive dissonance. It’s closer to the truth to see the ABCs as interconnected and mutually influential.
So, taking the behavioral realm first, on average, survey respondents report that since March, there has been a statistically significant decrease in how much people’s daily lives have been disrupted due to the COVID-19 pandemic.
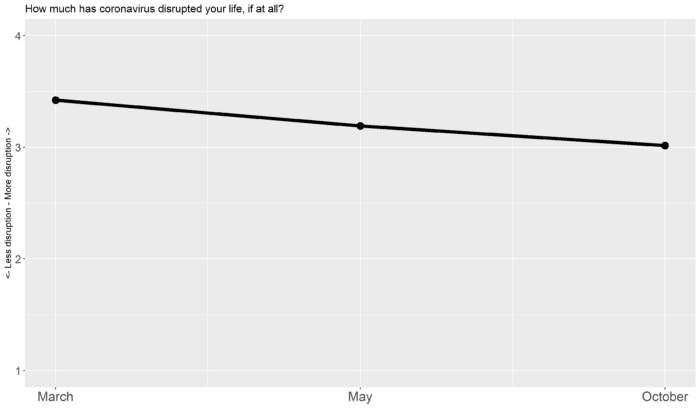
This is a clear trend but may seem rather small. The averages above show only about a 10% reduction in “life disruption” since March; nevertheless, declines like this are statistically significant, which suggests they are not ephemeral. Statistically significant differences like these, even small ones, can be quite consequential. Take for example the famous aspirin studies on heart patients. Those studies found only a 2% improvement in survival among people taking low dose aspirin as compared to a placebo, but the instant that difference was detected, they threw out the placebos and advised everyone to take the baby aspirin.
In other instances, the lack of a significant difference can be highly suggestive. For example, in most of the analyses reported here, no particular differences emerged among the various states and cities. When this happens, it suggests geography doesn’t matter much. Although these respondents lived thousands of miles apart, they’re all pretty much in the same boat.
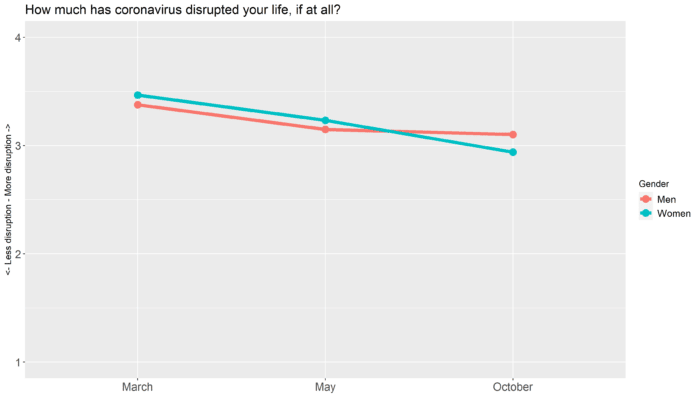
On the other hand, divergent trends were observed with respect to behavioral responses to the pandemic crisis. For example, most of the decrease in life disruption depicted above occurred among women in this sample. Note in the following graph how after the initial impact of the pandemic in March, the “average life disruption” reported by men seemed to level off. On the other hand, the trend among women has consistently gone down month by month. In March, the female respondents were reporting more disruption than the males but, by October, they switched places.
Another example of how Americans are loosening up can be seen in the following:
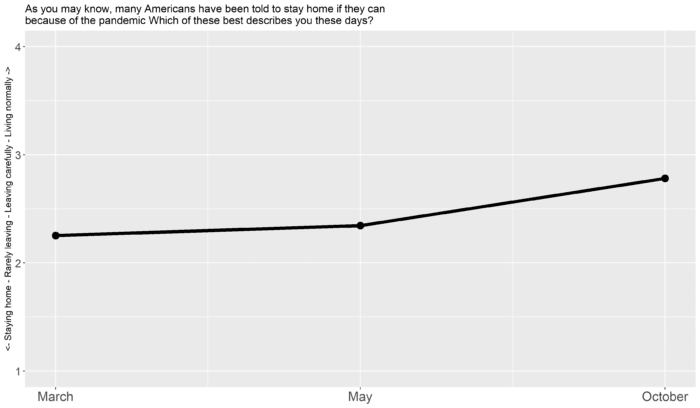
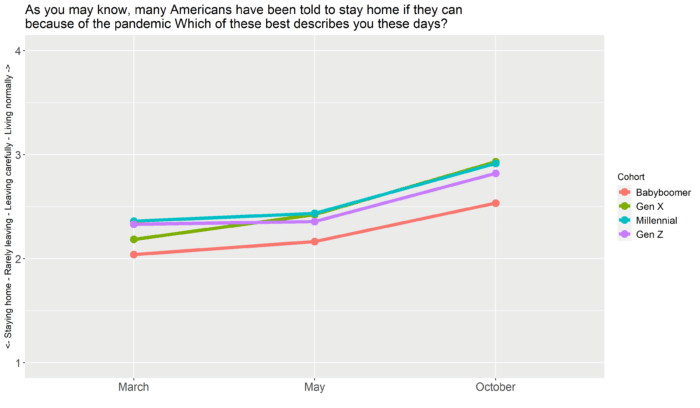
Above: Survey respondents seem to be moving significantly toward a return to normalcy, especially in the May to October time frame. On the other hand, this rebound is not uniform across generations. Using the definitions of Pew and others, the graph below splits responses by four cohorts: Babyboomers, Gen X, Millennials and Gen Z.
Although the trends are similar across cohorts, the oldest generation here, Babyboomers (red), are significantly more reticent to return to normal than the three younger generations.
Behaviorally then, these surveys suggest significant change. But what about the other ABCs? Are there also trends of a more cognitive nature, i.e. in how people perceive and process their pandemic experiences? Before human beings can think about an object, they must first perceive it. And perception is rarely objective. We all see the world through different social filters.
The thousands of participants in this longitudinal study have presumably watched the pandemic progress via a myriad of different media outlets, dipping into the swirling stream of news and opinions at a thousand different bends in the river, never touching the same stream twice at the same time and place. How do they evaluate the conflicting news about the crisis? Do they think the news is generally fair and accurate, or do they see the news as under- or over-estimating the hazard?
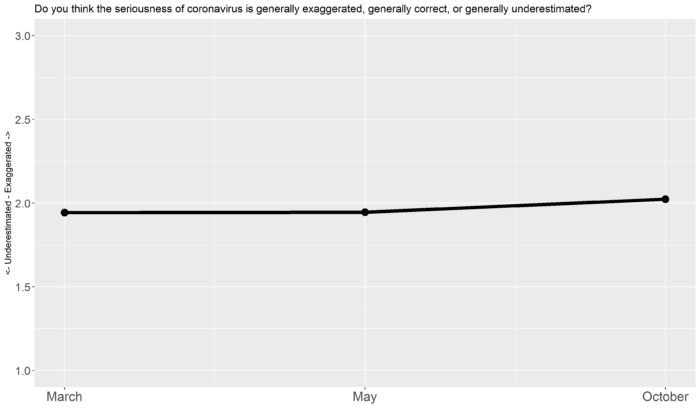
When it comes to the “average beliefs,” the ratings exhibit considerable stability. Through the months of this crisis, opinions have hovered closely to the “generally correct” line on the scale (i.e., a 2-rating on the 3-point scale), but this opinion is far from universally held. Divergent perceptions seem to be grounded in a larger political frame.
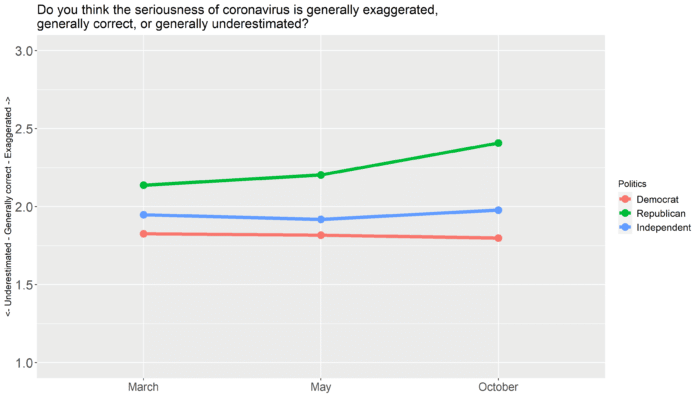
On average, the Democrats in this sample (red line) see the pandemic as more serious than do the Republicans (green line). Political Independents (probably a hodge-podge that means different things in different parts of the country) best reflect the overall average and landed closest to the “generally correct” line on the scale. Interestingly, between May and October, as the elections got closer, Republicans apparently came to see the pandemic crisis more and more as exaggerated.
Staying in the cognitive realm, one venerable field of study in human cognition is a concept called “locus of control.” People can have loci of control that are relatively internal or external. Are we masters of our own fates or at the mercy of others? Or, more saliently, how confident were our survey respondents in their own ability to handle the crisis?
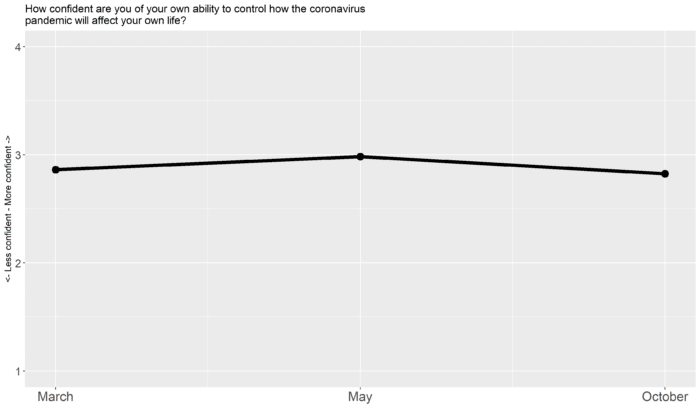
In the aggregate, these respondents’ sense of control over their own fates in the crisis seems pretty stable. The same trend was evident among virtually all demographic groups but a couple of significant differences did emerge.
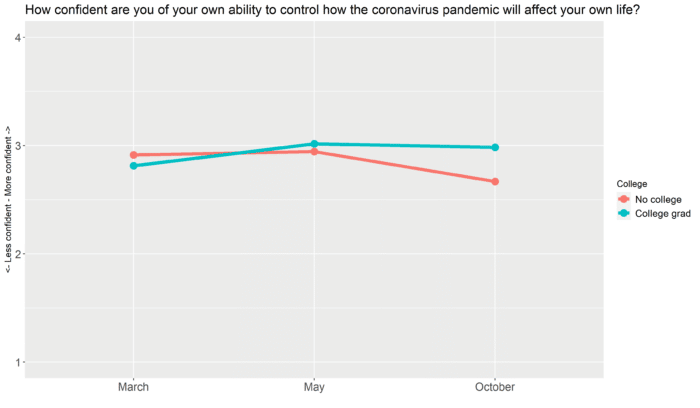
College and non-college subsamples here were reasonably close in self-confidence through May but then sharply diverged. As seen above, confidence among non-college respondents (red) fell from May to October. For the college grads, confidence rose from March to May, but thereafter seems to have levelled off.
Interestingly, locus of control was one of the few areas in this study where a significant difference across cities was observed.
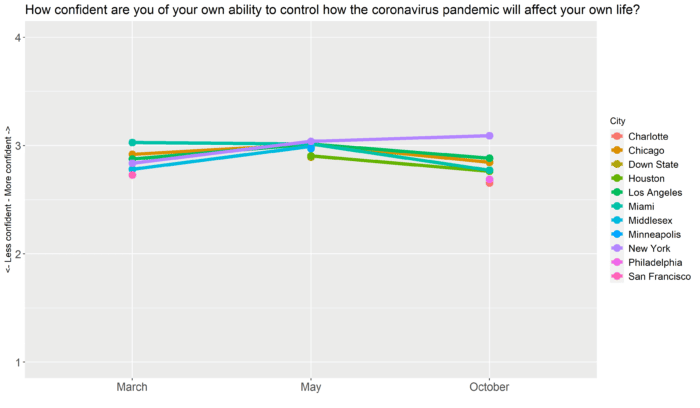
In most of these cities, confidence levels appear to have fallen. The only city that has shown a steady increase in self-confidence as the pandemic has progressed is the Big Apple (purple).
Finally, in the affective realm, the survey asked, “How concerned are you that you or someone you know will be infected with the virus?”
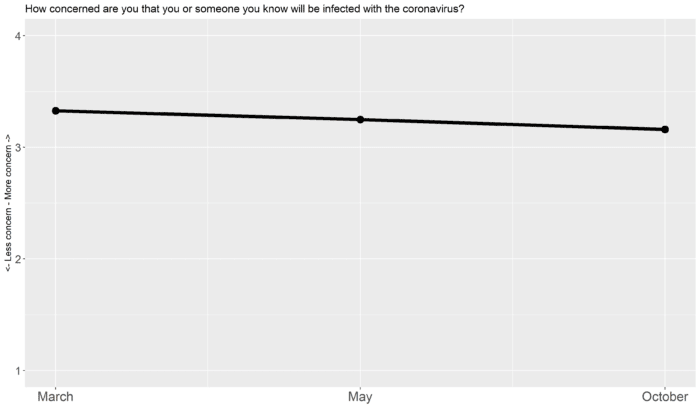
Again, it is a slight change, but significantly downward: Concerns are lessening.
Equally interesting is the paucity of statistical differences in concern or anxiety about the pandemic across demographic groups. The trend above is the same with men and women, with different ethnic groups, over education levels and across political boundaries. With the four generational cohorts in the study, however, a significant difference did emerge.
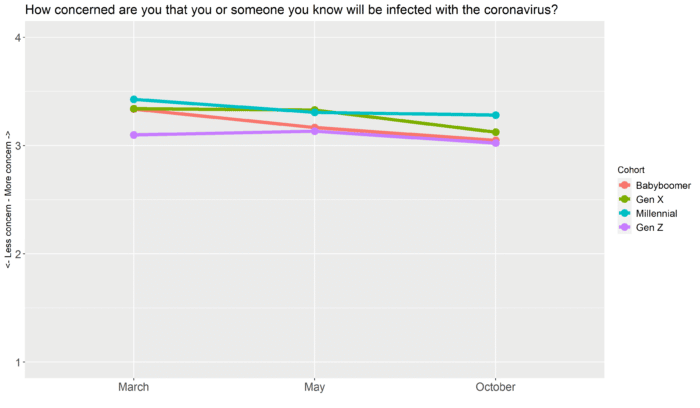
As one might have expected, the youngest generation, Gen Z (purple line), reports the least concern about contracting the virus. Millennials (blue-green), on the other hand, consistently report the highest levels of concern. Babyboomers (red) show the most consistent downward trend, which by October brought them more in line with their grandchildren than their own children.
So, what has this year of pandemic done to the American psyche, at least as represented by the nearly 3,000 residents of these large (and litigious!) cities? It is, of course, much too early to write the definitive history of these times, but contemporaneous accounts like the present report will, at the very least, give a bit of grist for some once and future academic mills.
It should not be surprising that an intensely social species like ours—even more so than termites and prairie dogs—is cautiously coming out of its burrows. Social norms might be changing, e.g., elbow-bumping replacing handshakes, but in spite of social distancing, masks and zoom calls, the impulse, indeed vital necessity, of engaging one’s social world will not be denied. One of the biggest differences observed here is in the realm of perception. Some see the pandemic almost as a slow-motion apocalypse or sword of Damocles, but others shrug it off. Presumably, most Americans see the same constant updates on infection, testing and fatality rates on their TVs or smart phones, but the news apparently goes through different political filters—not coincidentally with a political maelstrom brewing in the background! But although Americans might react differently to the pandemic behaviorally, although they might see the crisis through different perceptual lenses, how we all feel about the pandemic seems to be mostly the same.
About the Author:
Get to know Robert F. Bettler, Jr., Ph.D.
[1] States: CA=591 FL 435 IL 497 MN 153 NC 148 NJ 345 NY 376 PA 149 TX 293
Cities: Charlotte=145 Chicago 386 Down State 112 Houston 277 Los Angeles 449 Miami 418 Middlesex County 285 Minneapolis 150 New York 471 Philadelphia 141 San Francisco 147
Editoral Policy
Content published on the U.S. Legal Support blog is reviewed by professionals in the legal and litigation support services field to help ensure accurate information. The information provided in this blog is for informational purposes only and should not be construed as legal advice for attorneys or clients.

